Which conclusion is best supported by the survey results?
Analyze and Evaluate Information and Ideas · TELPAS Grades 10–12 reading. The correct answer, and the reasoning behind it.
Reporting category 3: make inferences, draw conclusions, and think about why the author wrote a text and how it is built.
Read the chart. Then answer the questions.
Library Survey Results
Read image description
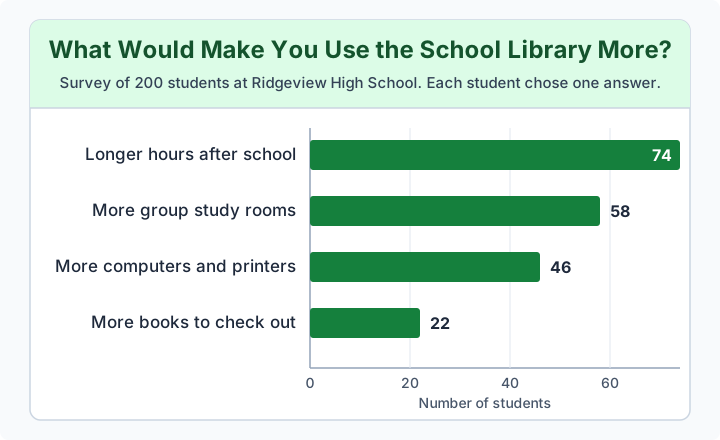
What Would Make You Use the School Library More?
Survey of 200 students at Ridgeview High School. Each student chose one answer.
Longer hours after school: 74 students
More group study rooms: 58 students
More computers and printers: 46 students
More books to check out: 22 students
The question
Choose the best answer.
Which conclusion is best supported by the survey results?
- More students want longer hours than want more books.Correct answer
- Most of the students in the survey never use the library.
- Over half of the students want more computers and printers.
- None of the students in the survey care about library books.
Why “More students want longer hours than want more books.” is correct
This asks for a conclusion that the data actually supports. Longer hours (74) is the largest group and more books (22) is the smallest, so the correct statement is directly shown. The wrong answers overstate the data or answer a question the survey did not ask, a common trap with charts.
Why the other answers are wrong
- Most of the students in the survey never use the library. — The survey asks what would make students use it more, not how often they use it now.
- Over half of the students want more computers and printers. — Only 46 of 200 students, less than a quarter, chose computers and printers.
- None of the students in the survey care about library books. — Twenty-two students chose more books; the smallest group is not zero.
Practice more of this
More reading practice for Grades 10–12, or see the TELPAS practice test for 10th–12th grade.
This is an independent study resource. It is not affiliated with, endorsed by, or connected to the Texas Education Agency or the official TELPAS program. All questions here are original practice material written to match the published test design.