Which conclusion is best supported by the chart?
Analyze and Evaluate Information and Ideas · TELPAS Grades 8–9 reading. The correct answer, and the reasoning behind it.
Reporting category 3: make inferences, draw conclusions, and think about why the author wrote a text and how it is built.
Read the chart. Then answer the questions.
Getting to School
Read image description
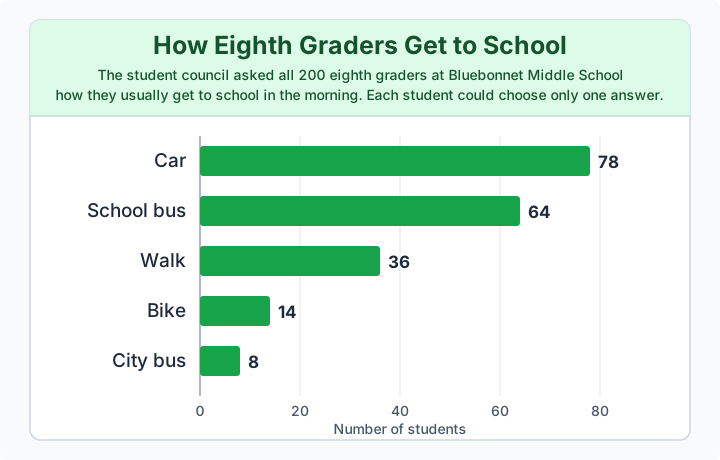
How Eighth Graders Get to School The student council asked all 200 eighth graders at Bluebonnet Middle School how they usually get to school in the morning. Each student could choose only one answer.
Car: 78 students
School bus: 64 students
Walk: 36 students
Bike: 14 students
City bus: 8 students
The question
Choose the best answer.
Which conclusion is best supported by the chart?
- More than half of the students ride in a car.
- More students bike than ride the school bus.
- More students ride the school bus than walk and bike combined.Correct answer
- Most of the students who took the survey walk or bike to school.
Why “More students ride the school bus than walk and bike combined.” is correct
This question asks the student to draw a conclusion from data. Walking and biking together are 36 plus 14, which is 50, and 64 students ride the school bus. The wrong answers each misread the numbers or the phrase "more than half."
Why the other answers are wrong
- More than half of the students ride in a car. — 78 is less than half of 200.
- More students bike than ride the school bus. — 14 students bike and 64 ride the school bus.
- Most of the students who took the survey walk or bike to school. — Only 50 of 200 students walk or bike.
Practice more of this
More reading practice for Grades 8–9, or see the TELPAS practice test for 8th and 9th grade.
This is an independent study resource. It is not affiliated with, endorsed by, or connected to the Texas Education Agency or the official TELPAS program. All questions here are original practice material written to match the published test design.